


If you want the fastest payback on solar in 2026, look at Hawaii, New York, and Connecticut in the US, and Australia, the UAE, and India globally. These markets combine high electricity prices, strong sun exposure, and incentives that still work in a homeowner’s favor — some paying back a system in as little as 3 to 7 years. Everywhere else, the math has gotten harder: the 30% federal tax credit expired at the end of 2025, and several countries are winding down net metering. Below, we break down exactly why these locations win, what the real payback numbers look like state by state and country by country, and how to run the math for your own roof.

Quick Summary
- Fastest US payback: Hawaii (5–7 years) and New York (6–9 years), driven by electricity above $0.22–$0.35/kWh
- Fastest global payback: UAE and Gulf states (2.5–5 years) and Australia (3–6 years)
- Biggest 2026 change: The 30% US federal solar tax credit expired December 31, 2025, adding roughly 2–4 years to most homeowners’ payback
- Worst US paybacks: Arkansas and Alaska, both stretching past 12–18 years due to cheap grid power or weak sun
- Rule of thumb: ROI tracks electricity price and incentive design more than raw sunshine — a cloudy, expensive-power state often beats a sunny, cheap-power one
Why Solar ROI Varies So Much by Location
Solar payback looks simple on paper: system cost minus incentives, divided by annual savings. In practice, four variables swing that number by a decade or more depending on where you live.
The Four Variables That Actually Decide Payback
Electricity price. This is the single biggest driver. Every kilowatt-hour your panels produce is worth whatever your utility would have charged you for it — so a system in a $0.35/kWh market pays back nearly twice as fast as an identical system in a $0.13/kWh market, sun exposure aside.
Net metering policy. How your utility compensates exported solar power matters almost as much as the rate itself. Full retail-rate net metering can shave 3–5 years off payback compared with “avoided cost” or wholesale-rate buyback. California’s shift to NEM 3.0 is the clearest recent example, pushing typical payback from around 6–7 years to 9–12 years for systems without battery storage.
Sunlight hours. More peak sun hours means more kilowatt-hours produced per panel, but this factor matters less than most homeowners assume — Phoenix’s abundant sunshine doesn’t automatically beat Boston’s higher electricity rate.
Government incentives. Tax credits, rebates, and performance payments directly cut the upfront cost or add ongoing income. This is the most volatile factor of the four, and 2026 is a turning point year for several major markets.
What Changed in 2026
Two policy shifts reshaped the ROI map this year:
- The US federal 30% residential solar tax credit (Section 25D) expired on December 31, 2025, nearly a decade ahead of its original phase-out schedule. A $20,000 system that effectively cost $14,000 after the credit now costs the full $20,000 before any state incentives, adding an estimated 2–4 years to payback nationwide.
- The Netherlands’ full-retail net metering scheme (salderingsregeling) ends January 1, 2027. Dutch homeowners installing in 2026 still lock in one final year of one-to-one offset before export compensation drops sharply, so timing matters there more than almost anywhere else in Europe.
These two changes are why national averages you may have seen from 2023 or 2024 no longer apply — most sources now put the global residential payback average at 6–10 years, up from closer to 5–8 years two years ago.
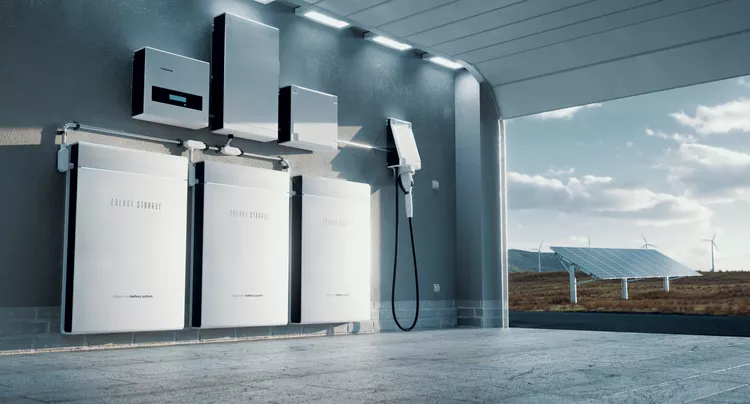
Best US States for Solar ROI in 2026
State-level incentives now do most of the heavy lifting since the federal credit is gone. States that pair high retail electricity rates with their own tax credits or rebates hold onto the fastest paybacks.
| State | Est. Payback | Avg. Electricity Rate | What Drives It |
|---|---|---|---|
| Hawaii | 5–7 years | $0.35–$0.43/kWh | Highest retail rates in the US by a wide margin |
| New York | 6–9 years | ~$0.22/kWh+ | 25% state tax credit (up to $5,000) stacks with NY-Sun rebates |
| Connecticut | 6–8 years | ~$0.25/kWh | Residential Solar Investment Program + high utility rates |
| Massachusetts | 6–8 years | High | SMART performance-based incentive program |
| California | 7–12 years | Moderate–high | NEM 3.0 cut export rates; battery pairing improves ROI |
| Arizona | ~11–12 years | Moderate | 300+ sunny days offset by no state tax credit |
| New Mexico | 11–14 years | $0.13–$0.15/kWh | Strong sun, but low electricity prices limit savings |
| Alabama | ~14 years | Low | Cheap grid power reduces value of each kWh offset |
| Alaska | ~13 years | Low sun exposure | Weakest 25-year savings total on this list |
| Arkansas | ~18 years | Very low | Cheapest install costs in the country, but grid power is too cheap to offset profitably |
Figures reflect post-federal-credit conditions and vary by utility territory, roof size, and installer pricing.
Best Countries for Solar ROI in 2026
Globally, the fastest-paying-back markets combine intense sun with genuinely high grid electricity prices — a combination the Gulf states and Australia both have in abundance.
| Country/Region | Est. Payback | Why It Ranks Here |
|---|---|---|
| UAE / Gulf states | 2.5–5 years | Extreme irradiance plus large-scale net metering programs like DEWA’s in Dubai |
| Australia | 3–6 years | High retail power prices, strong sun, and long-running STC rebate scheme |
| India | 4–6 years | Low install costs relative to electricity savings, aided by residential subsidy programs |
| Italy | 5–8 years | High retail prices (€0.28+/kWh) offset a scaled-back Superbonus incentive |
| Spain | 5–8 years | Strong southern irradiance plus IDAE grants covering 15–40% of costs |
| Netherlands | 5–9 years (2026 only) | Full net metering ends Jan 1, 2027 — install this year to lock in the rate |
| United States | 6–10 years | National average after the federal credit’s December 2025 expiration |
| Germany | 7–10 years | Lower irradiance offset by EEG feed-in tariffs and 0% VAT on installs |
| France | 7–11 years | EDF feed-in tariff helps, but incentives have narrowed for commercial-scale systems |
| United Kingdom | 8–12 years | 0% VAT through 2027 is the main lever; lower sun hours limit output |
How to Calculate Your Own Solar ROI
The formula behind every number above is straightforward, even if the inputs vary wildly by location:
- Get your net system cost — installed price minus any tax credits or rebates you actually qualify for.
- Estimate annual production — your installer’s proposal should show expected kWh/year based on your roof and local sun hours.
- Apply your real net metering rate — not the sticker retail rate, if your utility compensates exports at a lower “avoided cost” rate.
- Divide net cost by annual savings — the result is your payback period in years.
- Compare that to your panels‘ 25-year warranty — everything after payback is close to pure savings, minus minor maintenance and inverter replacement costs.
Two identical systems can land 5+ years apart in payback purely because of step 3 — so always ask an installer for your specific utility’s net metering terms before trusting a national or state average.
Bottom Line
If you’re chasing the fastest possible solar ROI, Hawaii and New York lead the US, while Australia and the Gulf states lead globally — all thanks to high electricity prices meeting strong sun and workable incentives. Everywhere else, payback now runs 7–14 years following the US federal credit’s expiration, which makes checking your state or country’s current incentive structure more important than it’s ever been. Run your own numbers before you sign a contract — location-specific electricity rates and net metering terms will move your real payback more than any national average ever will.
Data compiled from 2026 industry solar payback reports, U.S. EIA electricity pricing data, and published state/country incentive programs. Figures are estimates and will vary by installer, roof condition, and utility territory — use a personalized quote for exact numbers.